 Echolot
Home and Sonar
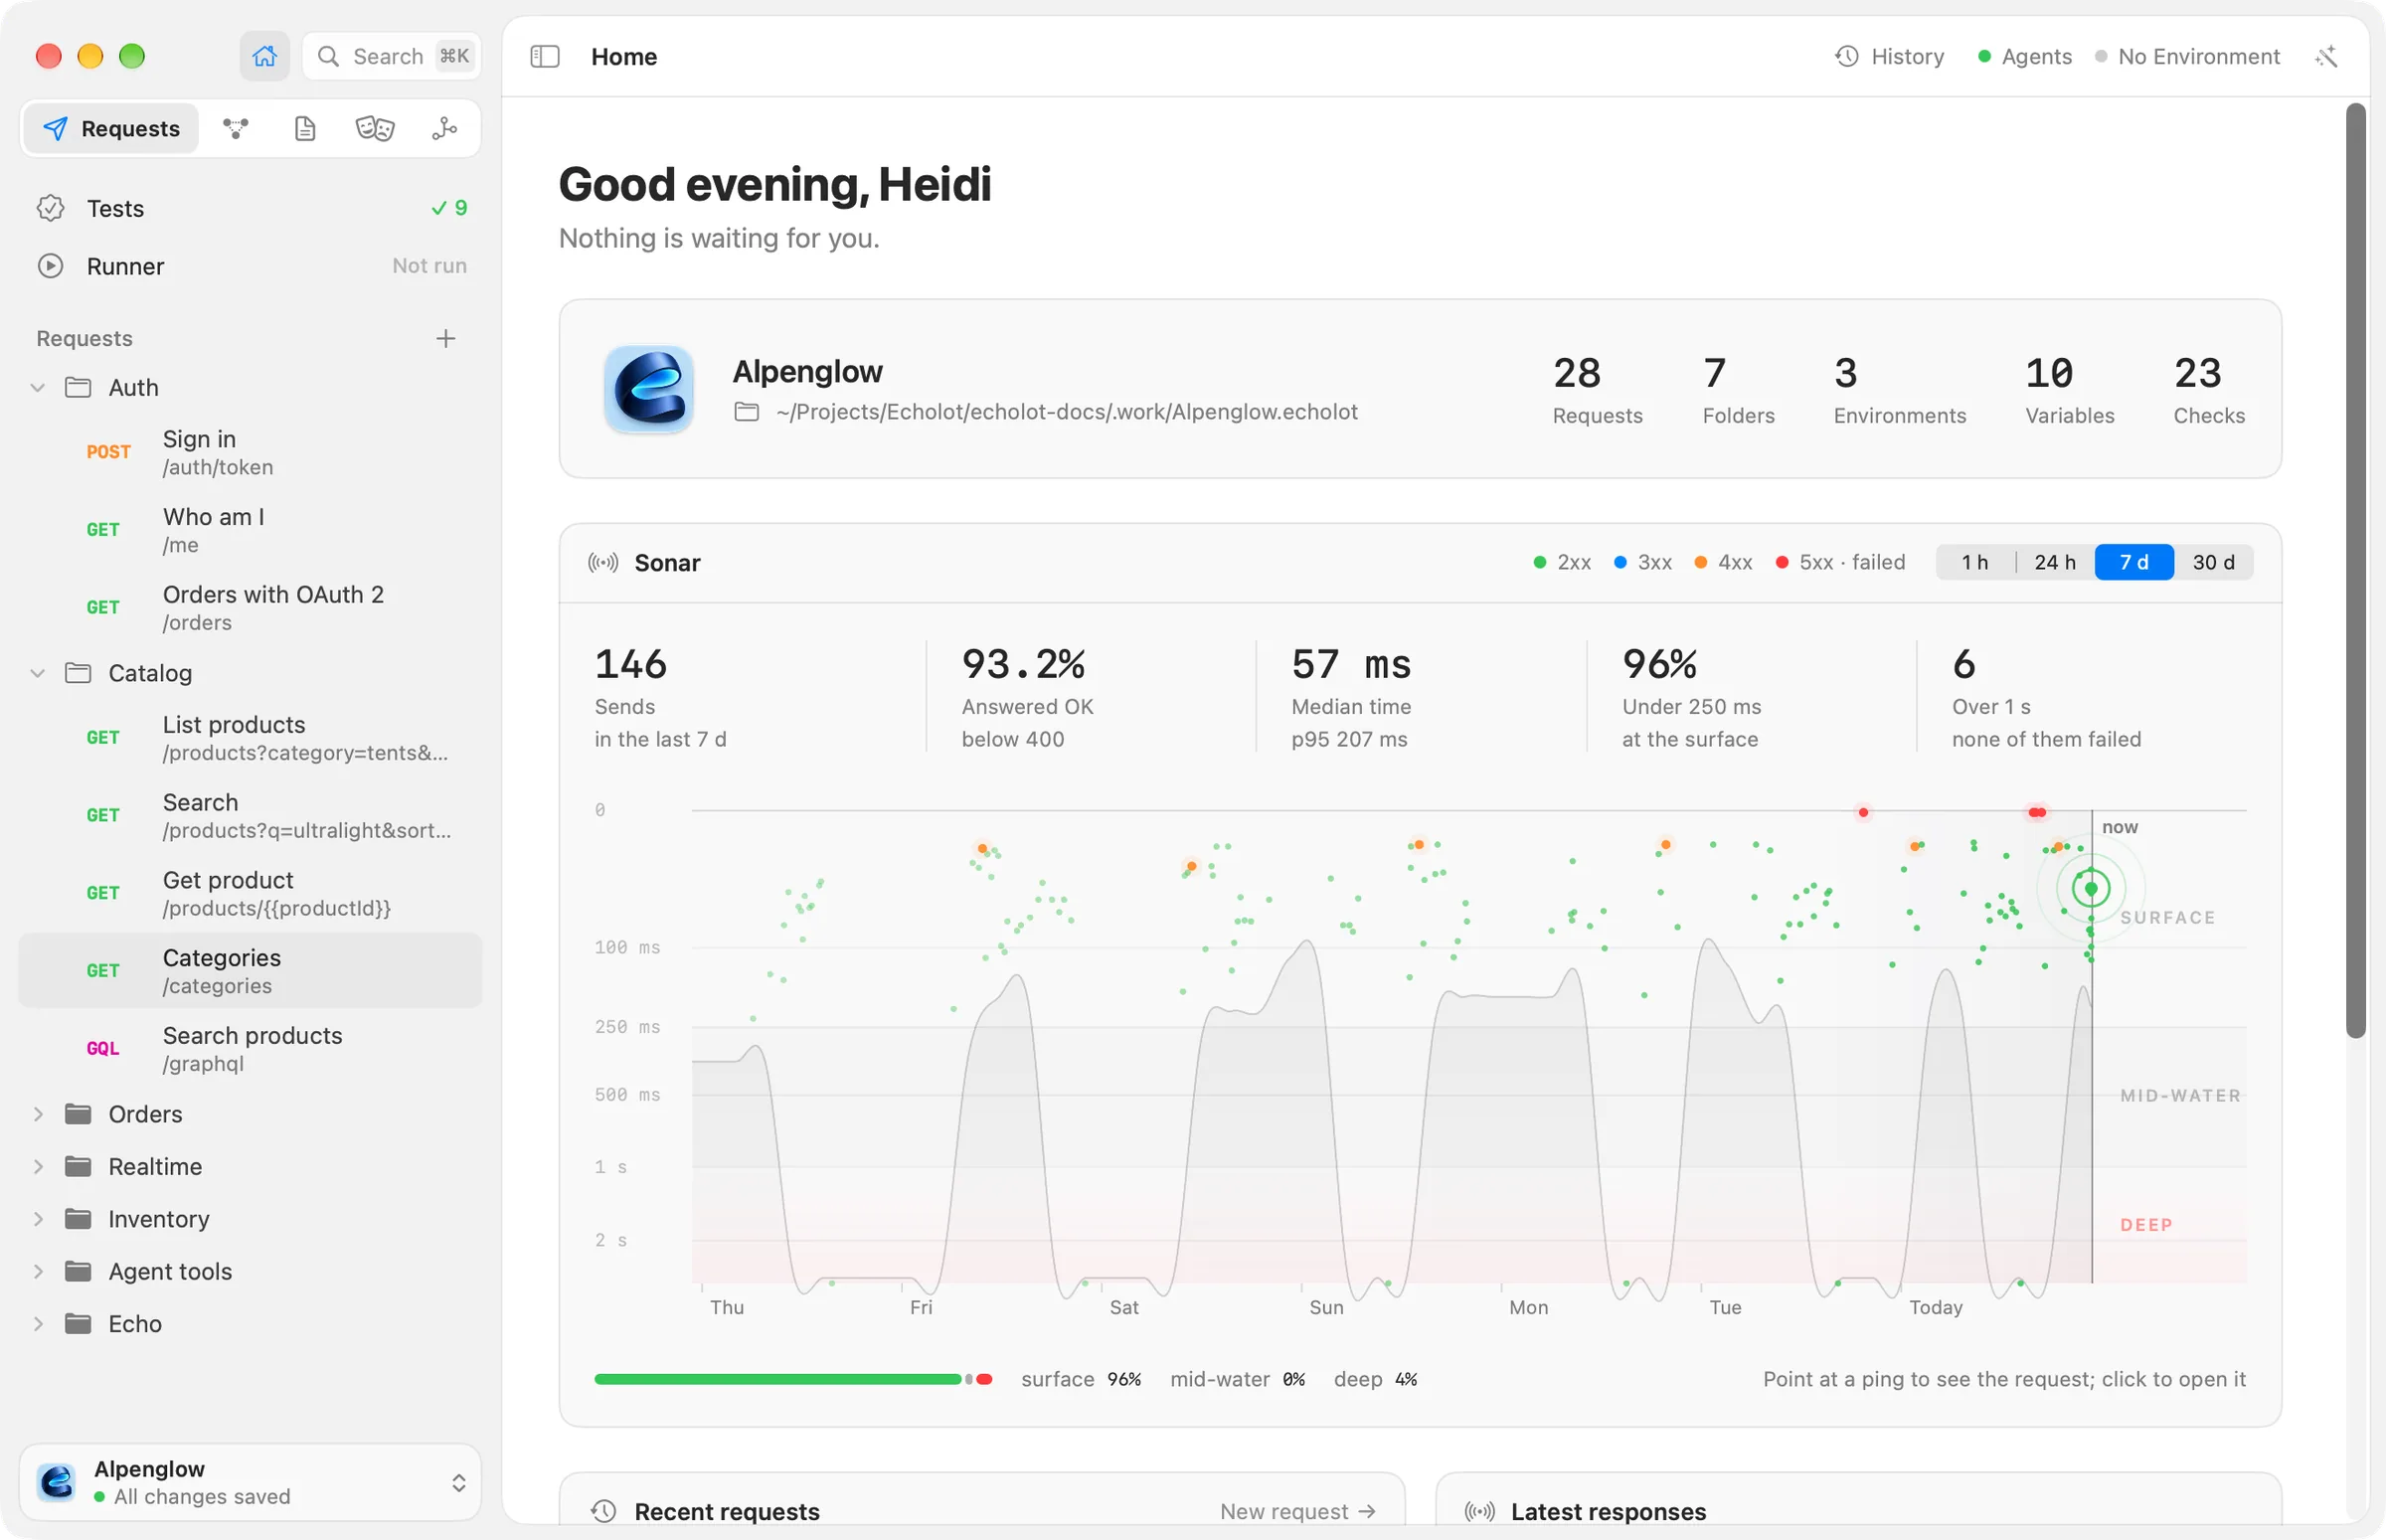
Home is the overview of a workspace; its Sonar card plots every send of the last hour, day, week or month by how long the answer took.
Home is the page a workspace window starts on. It tells you what is in the workspace, what needs a look, and how your requests have been answering. Open it from the sidebar's Home button or with ⇧⌘H.
What Home shows
From top to bottom:
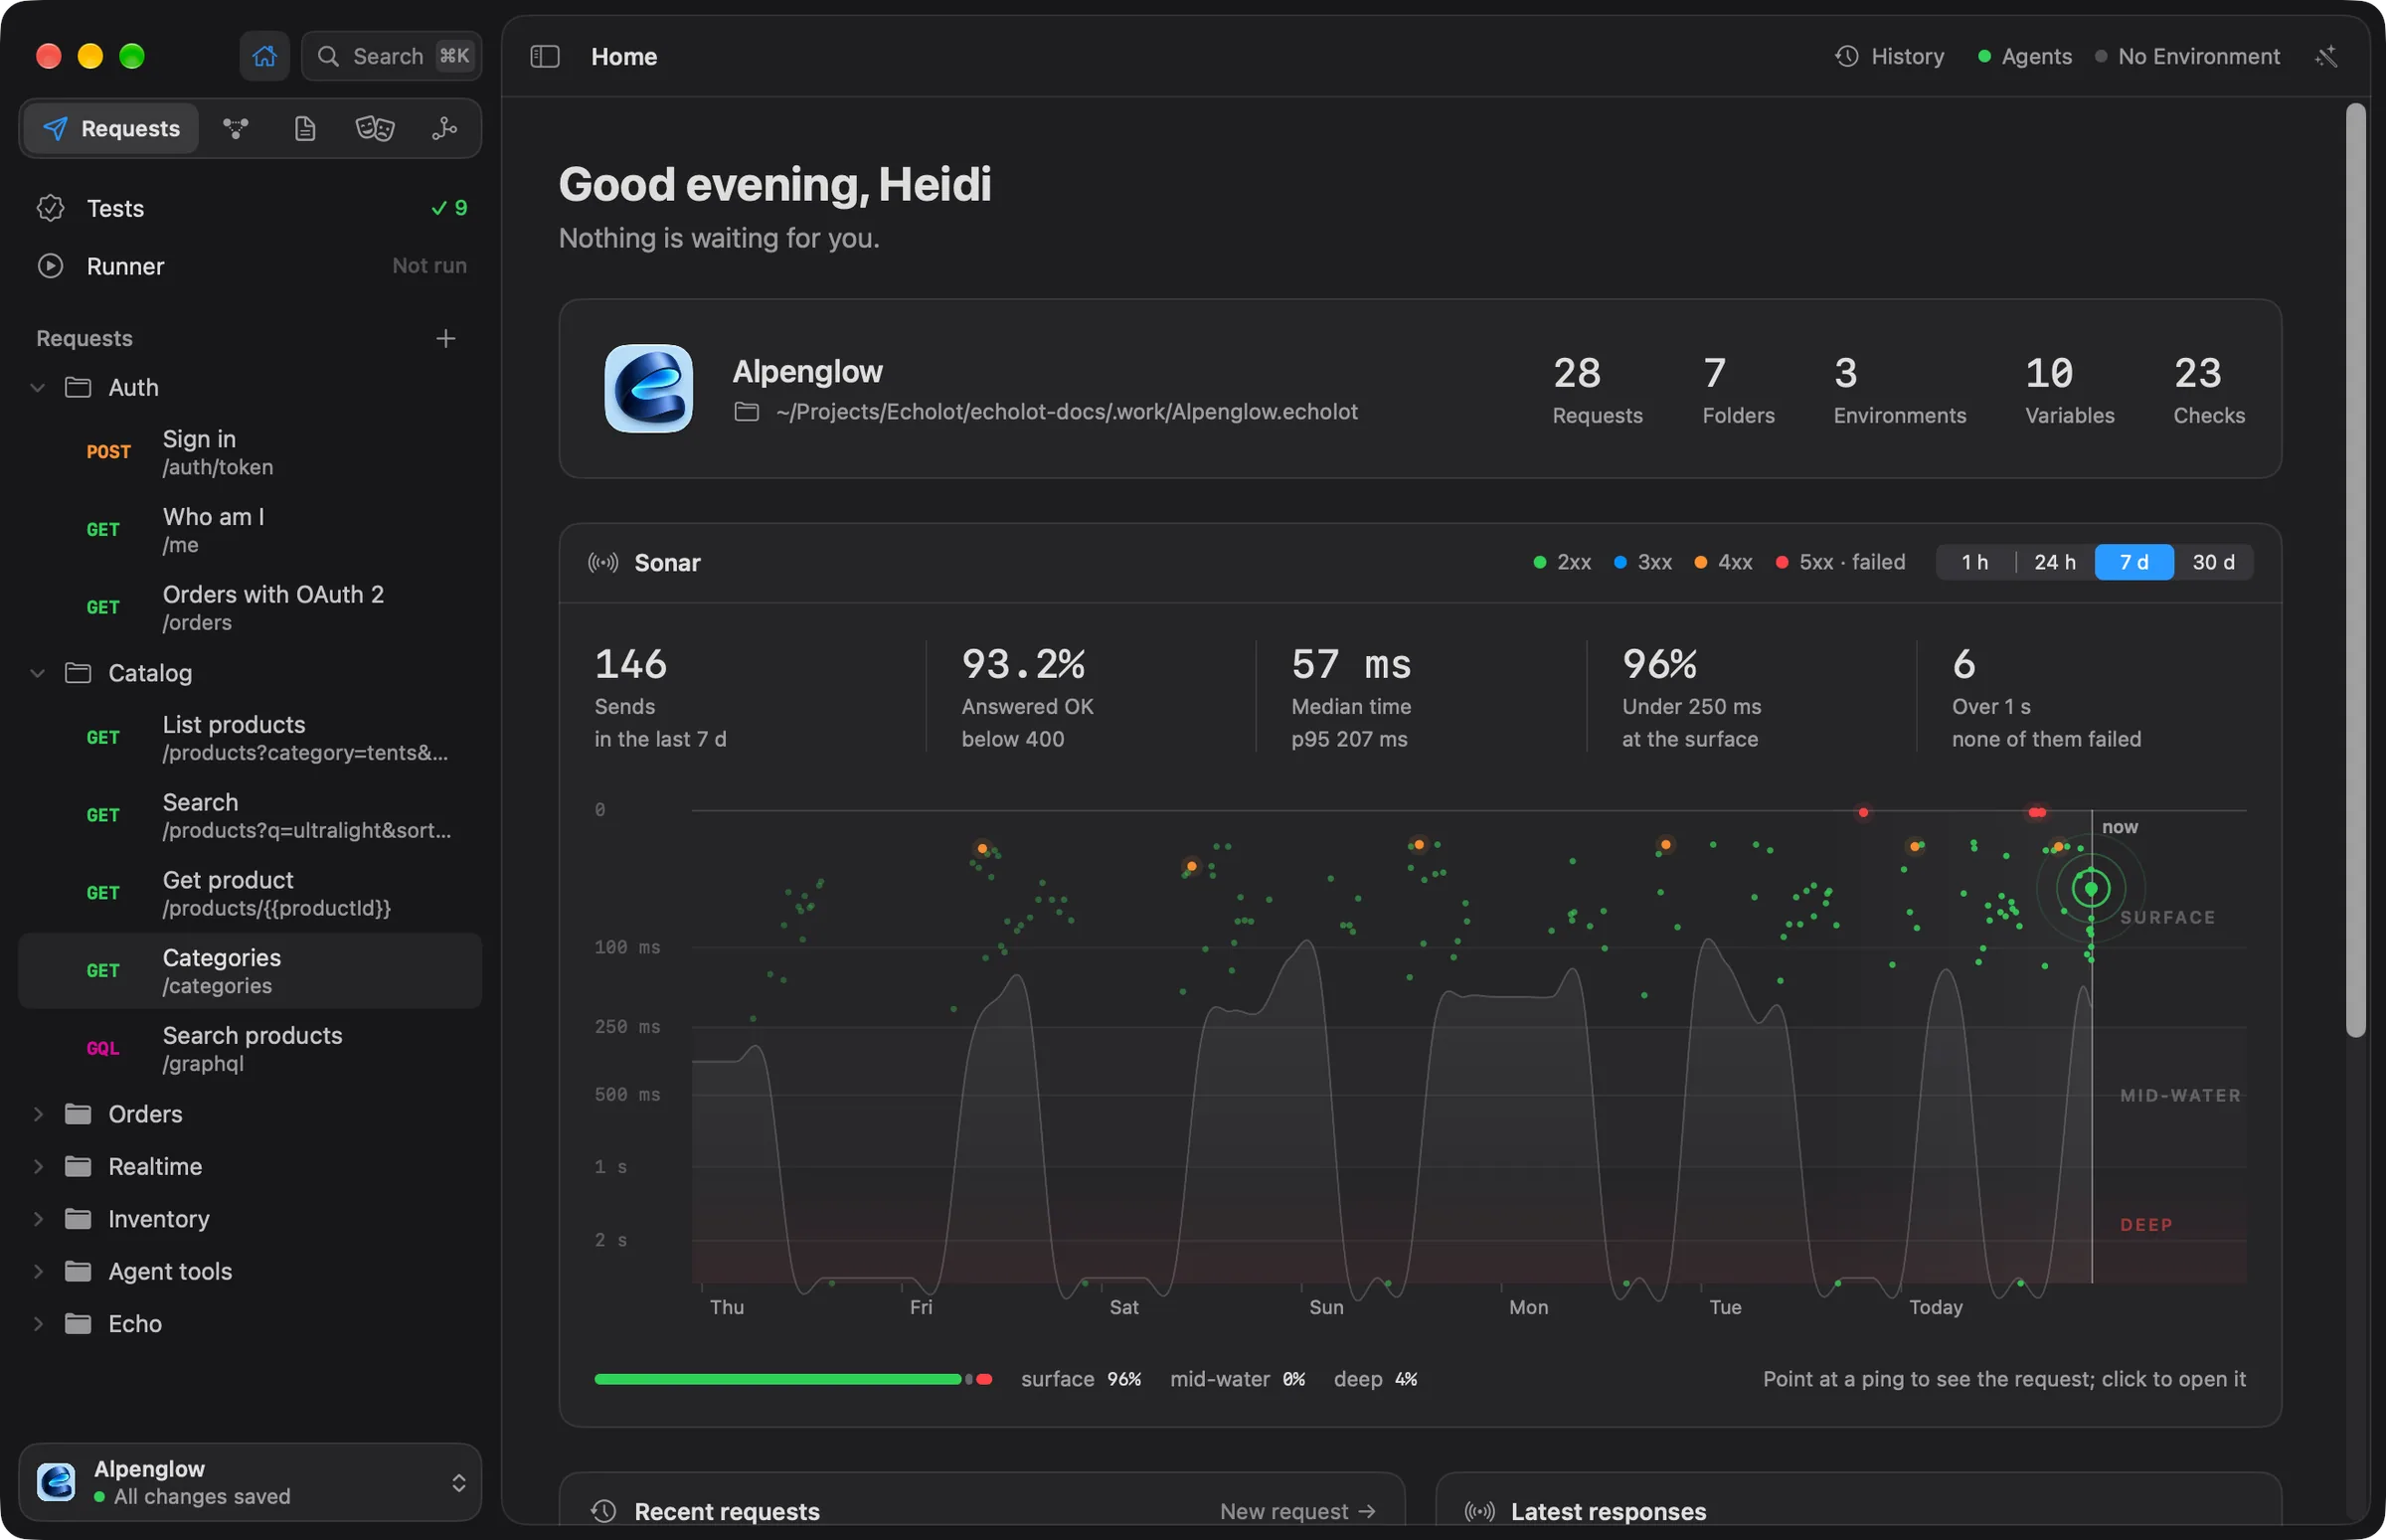
- A greeting and one sentence of news. It says how many checks are failing, or how many requests have unsaved changes, and otherwise Nothing is waiting for you. A new workspace with no requests asks you to import a collection or create the first request.
- The workspace: its name and folder, with the counts of Requests, Folders, Environments, Variables and Checks.
- Sonar, below.
- Recent requests, with New request; Latest responses; Tests, with how many requests have checks and which are failing, and View all; and Environments, with Manage and a mark on the protected ones.
Click a request or a response in a card to open it.
Sonar
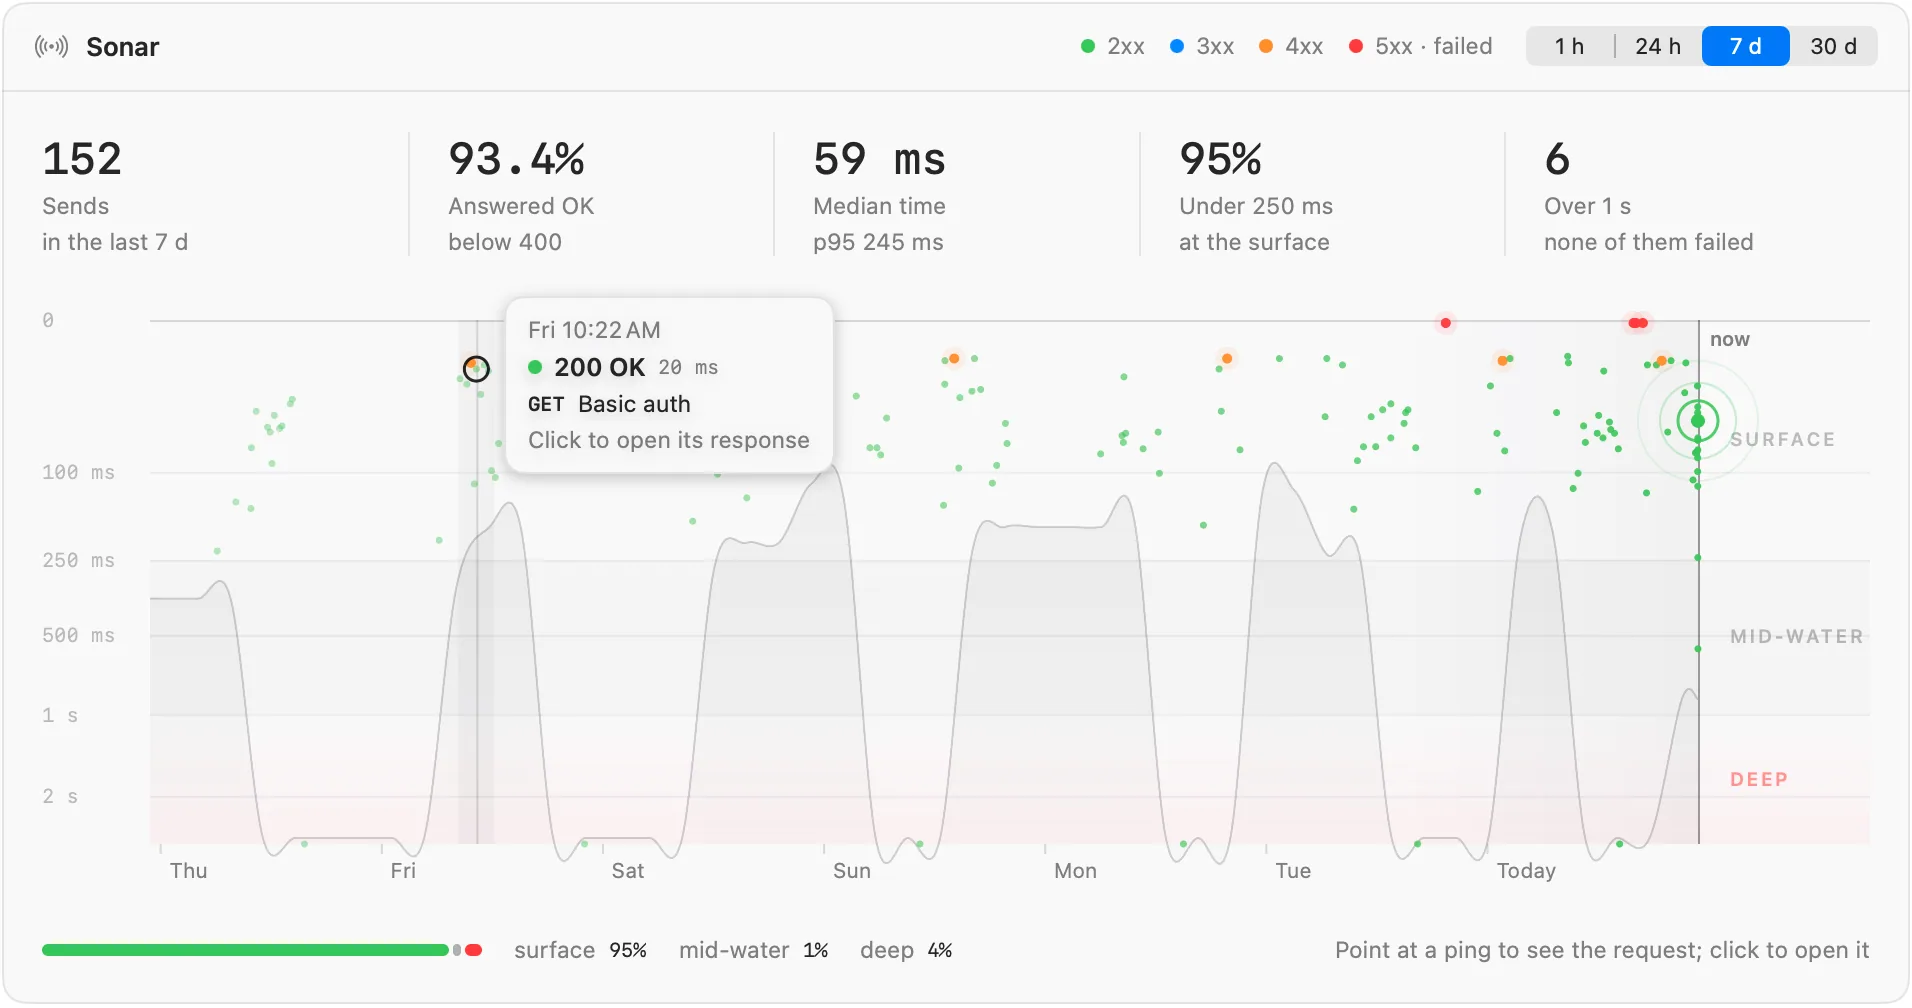
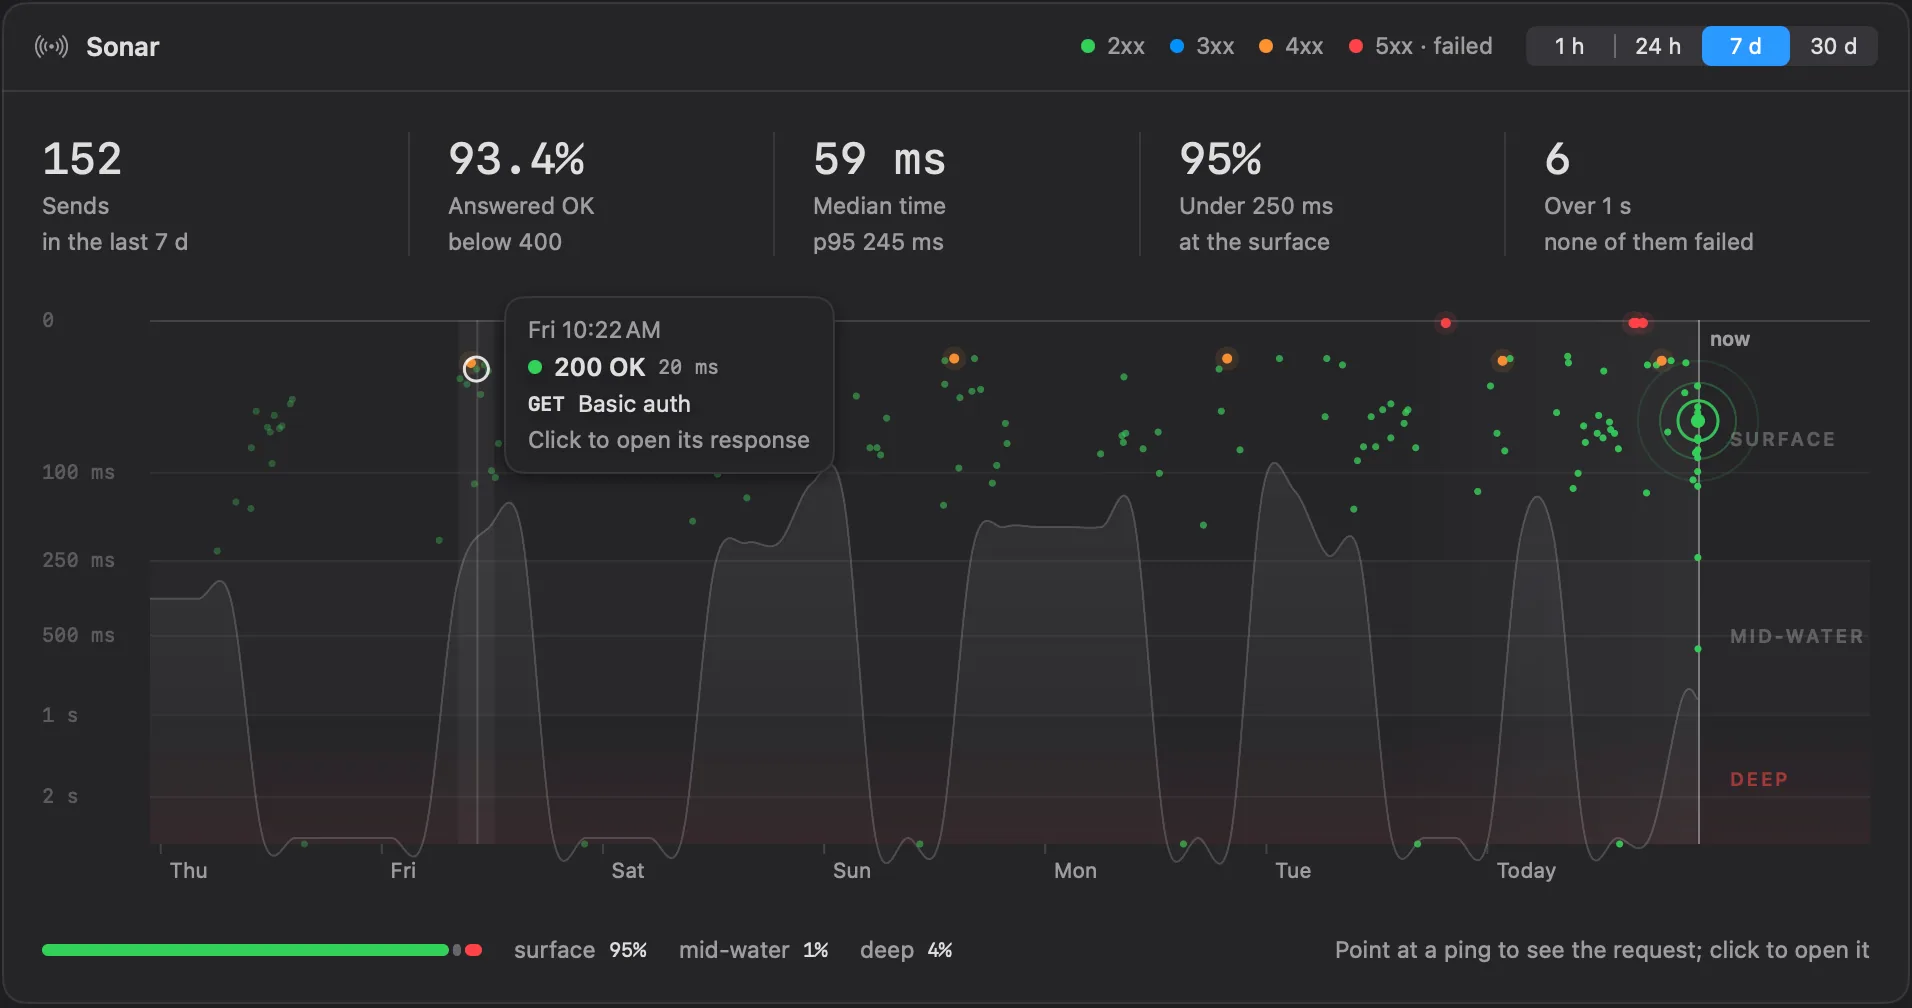
Sonar draws every send of a period as a ping, the way a sonar draws echoes. Time runs across, from the start of the period on the left to now on the right. The depth is how long the answer took: a quick answer stays near the surface, a slow one sinks. A glance tells you whether the API has been fast, where it slowed down, and whether something failed.
Reading the chart
- The zones. The depth scale is logarithmic, so both the fast and the slow end stay readable. SURFACE is anything under 250 ms, MID-WATER is 250 ms to 1 s, and DEEP is over 1 s.
- The colour of a ping is the class of its status. The key in the card's header names them: 2xx, 3xx, 4xx and 5xx · failed, which also stands for a send that got no answer at all.
- The seabed is the shaded floor under the slowest answers of each stretch of time. It rises and falls with them.
- The line at the right marks now. When a send finishes while Home is showing, a ripple spreads from its ping (not with Reduce Motion on).
- The bar under the chart shows how the period's sends split between the zones, in percent.
Point at a ping to see its request: when it was sent, its status and time, its method and name. Click it to open the request with that response showing. When there is nothing to open (the request was deleted or never saved, or the send got no response), the tip says Click to find it in History, and the click opens History searching for the request's name.
Choosing the period
The control in the card's header picks 1 h, 24 h, 7 d (the default) or 30 d. The chart and the figures follow it. A period without sends says that a request's echo appears here once you send one.
The figures
Five figures sit above the chart, each next to the same period before ("+12% on the week before"):
| Figure | What it counts |
|---|---|
| Sends | Requests sent in the period. |
| Answered OK | The share of sends answered with a status below 400, with the change in percentage points. |
| Median time | The middle response time, with the p95: 95 of 100 sends were faster. |
| Under 250 ms | The share of sends at the surface. |
| Over 1 s | How many sends were deep, and how many of those failed. |
In a narrow card only the first three show.
What Sonar counts
- The figures count every send still in the workspace's history. Sends you cleared, or that the history's limits removed, no longer count. The chart draws the most recent ones.
- Sonar counts HTTP, GraphQL, gRPC and MCP requests, whoever sent them: you, the Runner, a flow or an agent. WebSocket, Socket.IO and MQTT sessions stay open for as long as you like, so they have no response time and aren't drawn.